Webinar

Summer 2024 Investment Outlook – July 23 Replay

Is the growth momentum sustainable?

Key takeaways

  • While markets wait for Federal Reserve interest rate cuts, yields on some shorter-term Treasury securities continue to exceed those of most longer-term Treasuries.

  • While this so-called “inverted yield curve” is viewed by some market observers as an indicator of potential recession, the economy continues to demonstrate resilience.

Investors increasingly anticipate that in September the Federal Reserve (Fed) will initiate interest rate cuts. After yields on the 10-year U.S. Treasury note peaked at 4.70% in April, yields dropped below 4% in August.1 This is considered a generally favorable trend resulting in positive total returns for bond investors, but it also exacerbates a phenomenon dating back nearly two years – the inverted yield curve.

This is an unusual situation where yields on certain shorter-term Treasury securities exceed those of longer-term securities. An inverted curve environment emerged in 2022 and has persisted since, though the inversion has flattened in 2024. An inverted yield curve contrasts with investor expectations – namely, to generate higher income by investing in longer-term debt.

“Once the Fed starts to cut rates, investors need to have fixed income assets anchored on the longer end of the yield curve to protect their income streams over time,” says Rob Haworth, senior investment strategy director at U.S. Bank Wealth Management.

The inversion is closely tied to Fed interest rate policy. Beginning in early 2022, the Fed began raising the short-term target federal funds interest rate it controls. Since July 2023, the policy-making Federal Open Market Committee has maintained the fed funds rate at a range of 5.25% to 5.50%. This compares to near 0% in 2022, before the Fed began raising rates.

“The fed funds target rate has a fairly direct impact on the short end of the yield curve,” says Rob Haworth, senior investment strategy director at U.S. Bank Wealth Management. “Longer term rates move more independently, so they may fluctuate up-and-down, but we’re seeing very little movement in short-term rates.”


Understanding the yield curve

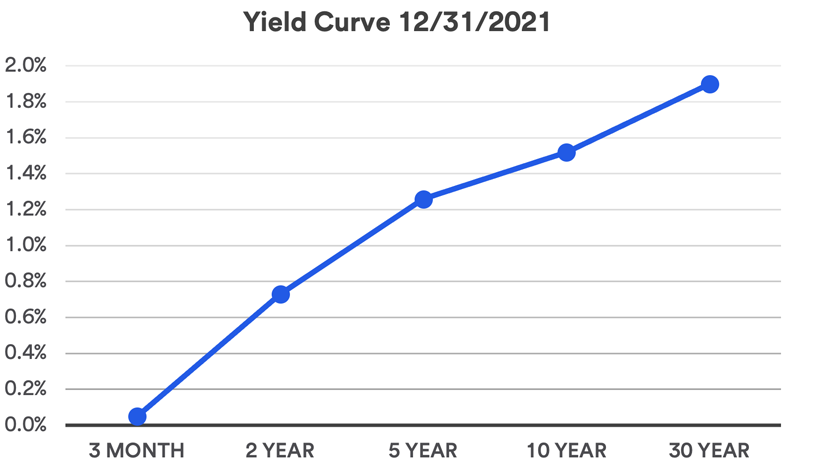
A simple way to view the yield curve is by comparing current interest rates, or yields, on U.S. Treasury securities with maturities of three months, two years, five years, 10 years and 30 years. Investors typically demand higher yields when investing their money for longer periods of time. This is referred to as a normal, upward sloping yield curve. In this scenario, yields rise along the curve as bond maturities lengthen. The chart below depicts a normal, upward sloping yield curve among these U.S. Treasury securities of varying maturities, depicting actual yields in the Treasury market at the end of 2021. At that time, the yield on 3-month Treasury bills stood at 0.05% and moved progressively higher as maturities extended along the yield curve, up to a yield of 1.90% on 30-year Treasury bonds.1

Chart depicts a normal, upward sloping yield curve among five U.S. Treasury securities, depicting actual yields in the Treasury market at the end of 2021.
Source: U.S. Department of the Treasury, December 31, 2021.

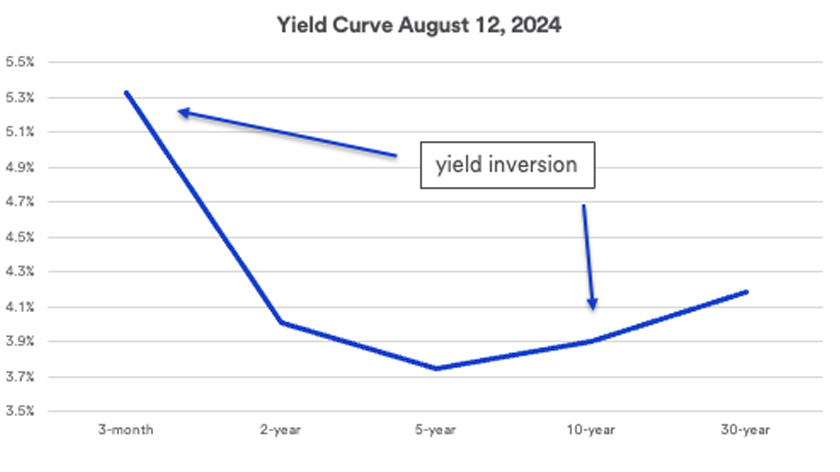
However, at rare times, the yield curve “inverts.” The use of this term does not necessarily indicate that the slope moves consistently higher to lower across the yield spectrum when reading the chart from left to right. But it can mean that yields on some shorter-term securities are higher than those for some longer-term securities.

In July 2022, 2-year Treasury yields first exceeded those of 10-year Treasuries. Then in late October 2022, the yield on the very short-term 3-month Treasury bill moved above that of the 10-year Treasury note. Those inversions continue today.1

Chart depicts an inverted, downward sloping yield curve among five U.S. Treasury securities, depicting actual yields in the Treasury market as of August 12, 2024.
Source: U.S. Department of the Treasury, as of August 12, 2024.

The shape of the yield curve inversion changed over the course of 2024. There was a more pronounced inversion earlier in the year. Now, while yields on 3-month Treasuries remain above 5.3%, yields on 2-year Treasuries are only modestly higher than yields for 10-year Treasuries. The 2-year Treasury yield advantage was much more pronounced earlier.1

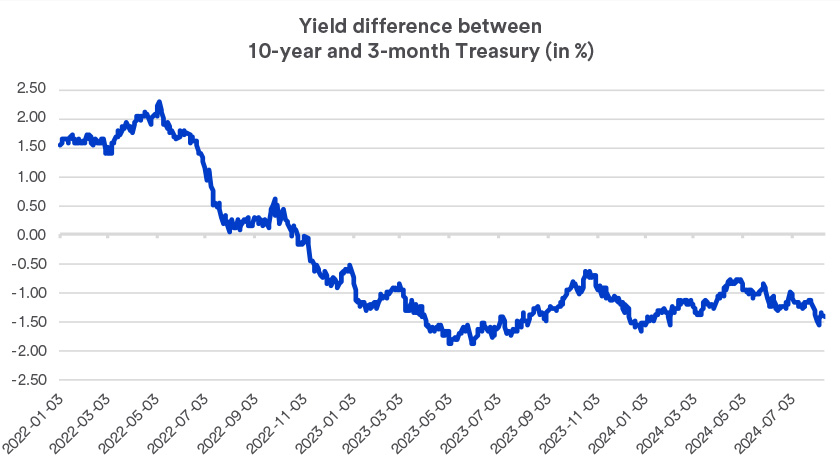
Another way to monitor the yield curve’s trend is the spread between 3-month Treasuries and 10-year Treasuries. In 2024, the negative interest rate spread narrowed (see chart below), but the recent environment modestly expanded the spread in favor of 3-month Treasuries. In mid-summer, yields on 10-year Treasuries declined, while 3-month Treasury yields generally held their ground, causing the negative yield spread to modestly widen.1

Graph depicts the differences in yields paid on 10-year U.S. Treasury bonds and 3-month U.S. Treasury notes as of August 12, 2024.
Source: Federal Reserve Bank of St. Louis. As of August 12, 2024.

Haworth says the rate spread is dependent on Fed actions. “The inverted yield curve is most likely with us until those Fed rate cuts begin.”

The inversion between the two-year and 10-year Treasury, often considered a signal of a pending recession, has been in place since early July 2022, the longest period of an inverted curve in history.2 Yet no recession has occurred in that time. “You would typically see a recession by now,” says Haworth, “but keep in mind that we’re in a unique environment that’s included a lot of fiscal stimulus and that started from a point of zero interest rates.” Haworth believes these unusual circumstances may account for the inverted curve’s false recession reading to this point.


How the yield curve could change

The next question is when to expect a return to a normal, upward sloping yield curve, when long-term bond yields exceed those of shorter-term bonds. Haworth sees two different scenarios, one preferred over the other.

“If long-term bond yields begin to fall, it likely reflects declining inflation. As that occurs, the Fed will feel more comfortable cutting short-term rates.” Haworth believes that the preferred way to see the yield curve return to normal is with short-term rates declining more precipitously than long-term rates. Declining short-term Treasury yields would likely follow fed funds rate cuts.

Haworth says the “Goldilocks” version of this scenario is one where declining inflation is paired with a growing economy. “In this circumstance, the Fed will feel more confident about its ability to lower rates without risking a significant inflation uptick.”

A less desirable scenario, according to Haworth, is one where the economy appears at risk. “The Fed will cut short-term rates to offset a recession threat,” says Haworth. “That could happen, for example, if unemployment suddenly moves sharply higher, which could temper consumer spending power and trigger a recession.”

Capital markets reacted sharply to the July jobs report (issued in early August) that showed slower-than-expected job growth and a bump up in the nation’s unemployment rate, to 4.3%. It caused a dramatic, short-term equity market decline with investors flocking to fixed income markets. That caused a drop in 10-year Treasury yields. Investors began to more actively anticipate pending Fed rate cuts to stave off a possible recession, though the Fed has not yet provided clear signals of its rate-cutting intentions.

Haworth doesn’t rule out the possibility that a recession could still occur, as many believes the inverted yield curve signals. But he notes that to this point, the U.S. economy has managed to stay on track. “The data shows us that there’s still demand for labor and a growing number of people looking for work, so that tells us that the economy continues to expand.”

Haworth also cautions about the economic challenges stemming from the current interest rate environment, as it creates headwinds for business investment. “It represents a steeper cost for corporations. With short-term rates so high, companies could become increasingly reluctant to borrow, as it is more challenging to realize a payoff when investing the borrowed capital in new equipment and facilities or added employees.” Yet Haworth notes today’s unusual environment may also work to the benefit of many large companies. “Companies that have cash on the balance sheet, even if they also issue debt, are earnings higher yields on cash reserves, offsetting some of their higher borrowing costs.”


Investment considerations in today’s unusual environment

With yields higher on short-term securities, it’s no surprise investors have put significant sums to work on the short-end of the yield continuum. However, Haworth recommends investors also consider longer-term bonds, with yields that are far more attractive today than they were at the start of 2022. “It’s important to get today’s higher, long-term rates locked in before yields begin turning significantly lower,” says Haworth. “Once the Fed starts to cut rates, investors need to have fixed income assets anchored on the longer end of the yield curve to protect their income streams over time.”

One consideration for bond investors is the risk of rising interest rates. When interest rates rise, values of bonds held in an existing portfolio lose market value. “A 30-year bond is much more sensitive to interest rate movements than a 6-month bond,” says Eric Freedman, chief investment officer for U.S. Bank Wealth Management. Yet Freedman believes attractive interest rates create opportunities for investors. “It may be a time for fixed income investors to spread out exposures across the maturity spectrum.”

Haworth notes there’s increasingly positive investor sentiment for non-Treasury segments of the market. With certain non-taxable portfolios, this includes non-government agency issued residential mortgage-backed securities, while managing total portfolio duration using longer-maturity U.S. Treasuries. Certain tax-aware portfolios can benefit from municipal bonds, including some longer-duration and high-yield municipal securities. Trust portfolios may benefit from reinsurance as a way of capturing differentiated cash flow with low correlation to other portfolio factors.

Check-in with your wealth planning professional to make sure you’re comfortable with your current mix of investments and that your portfolio’s asset allocations remain consistent with your goals, risk appetite and time horizon.


Frequently asked questions

Related articles

Is the economy at risk of a recession?

The Federal Reserve is focused on fighting inflation with monetary policy intended to slow consumer demand. Does this put the economy at risk of a recession?

Cash management and investing strategies when interest rates are up

A fresh look at managing your cash and investments in today’s changing interest rate environment can help support your pursuit of the goals that matter most to you.

Start of disclosure content

Disclosures

  1. Source: U.S. Department of the Treasury, Daily Treasury Par Yield Curve Rates.

  2. Barbuscia, Davide, “U.S. Treasury key yield curve inversion becomes longest on record,” Reuters.com, March 21, 2024.

Start of disclosure content

Investment and insurance products and services including annuities are:
Not a deposit • Not FDIC insured • May lose value • Not bank guaranteed • Not insured by any federal government agency.

U.S. Wealth Management – U.S. Bank is a marketing logo for U.S. Bank.

Start of disclosure content

U.S. Bank and its representatives do not provide tax or legal advice. Your tax and financial situation is unique. You should consult your tax and/or legal advisor for advice and information concerning your particular situation.

The information provided represents the opinion of U.S. Bank and is not intended to be a forecast of future events or guarantee of future results. It is not intended to provide specific investment advice and should not be construed as an offering of securities or recommendation to invest. Not for use as a primary basis of investment decisions. Not to be construed to meet the needs of any particular investor. Not a representation or solicitation or an offer to sell/buy any security. Investors should consult with their investment professional for advice concerning their particular situation.

U.S. Bank does not offer insurance products but may refer you to an affiliated or third party insurance provider.

U.S. Bank is not responsible for and does not guarantee the products, services or performance of U.S. Bancorp Investments, Inc.

Equal Housing Lender. Deposit products are offered by U.S. Bank National Association. Member FDIC. Mortgage, Home Equity and Credit products are offered by U.S. Bank National Association. Loan approval is subject to credit approval and program guidelines. Not all loan programs are available in all states for all loan amounts. Interest rates and program terms are subject to change without notice.